WWW analysis
Opened websites
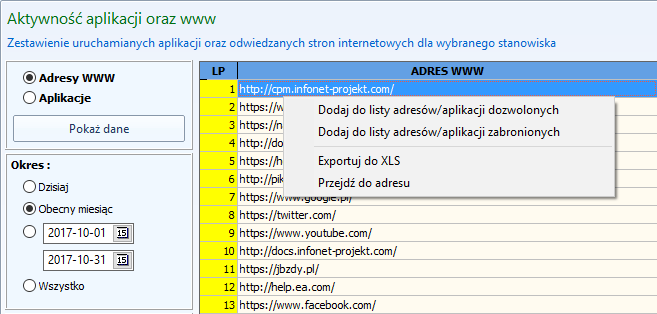
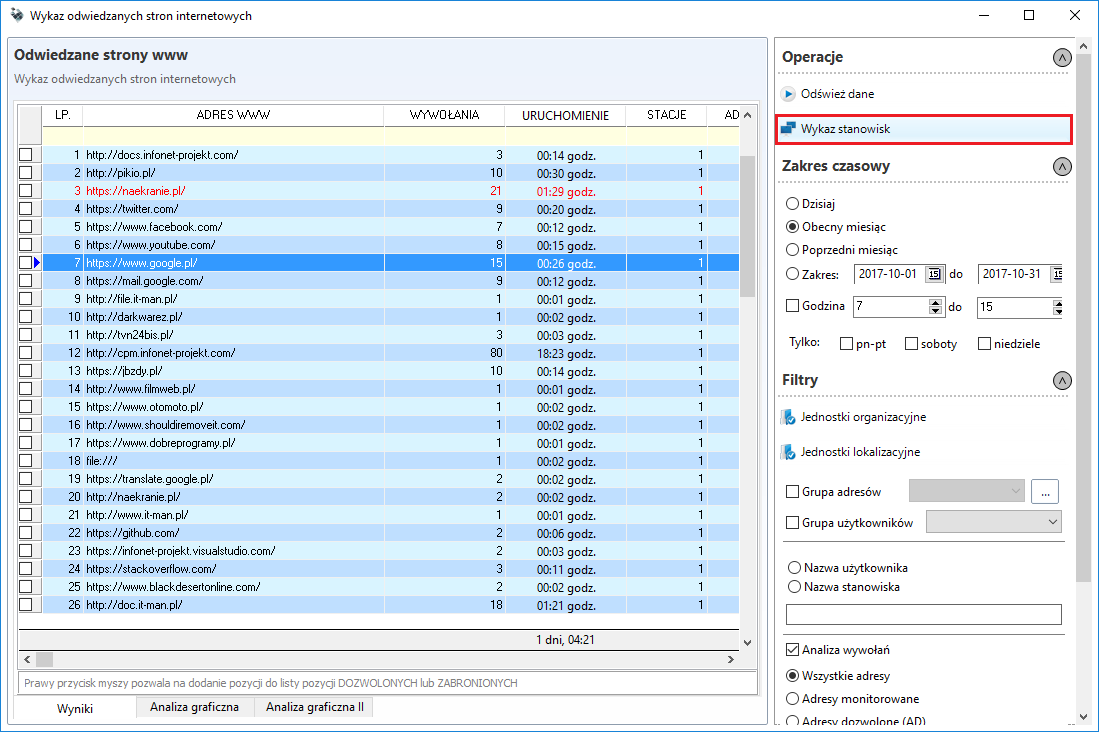
In the Opened websites window you will find information about the addresses visited at the stations in question.
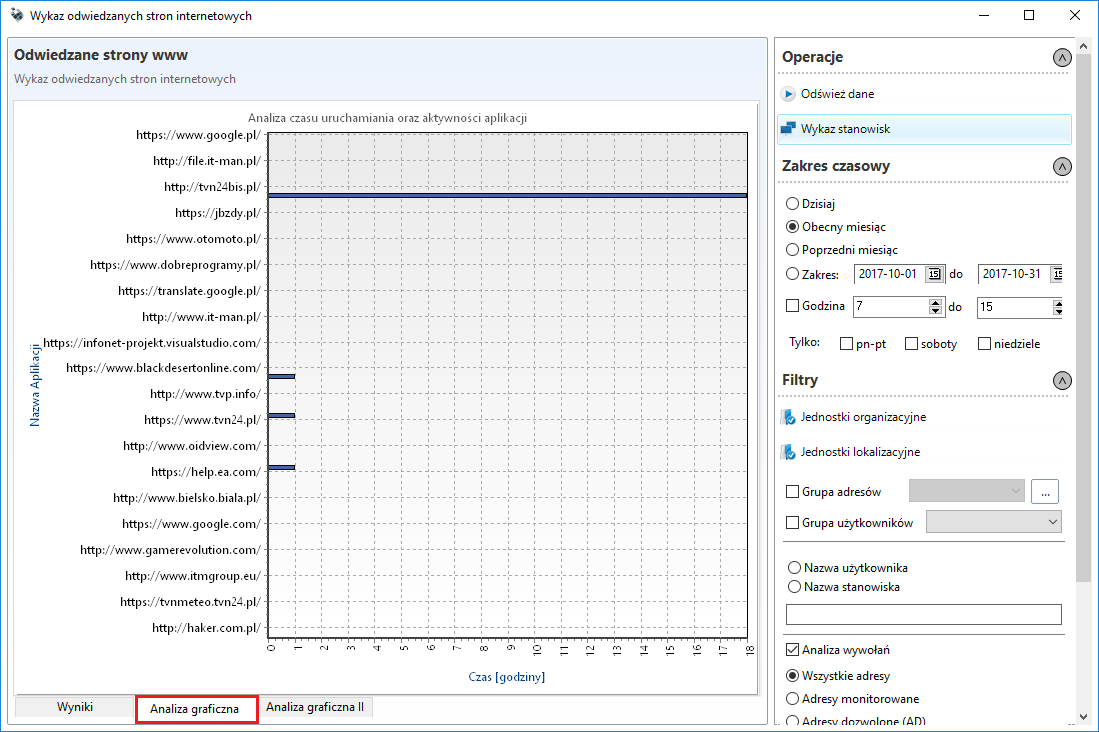
The tab Graphic analysis shows data about visited addresses in a graphic form.
After setting parameters such as the scope of work or organisational units and displaying the list of addresses by clicking on a given address or on the Workstation list button, a new window with detailed information on the positions where specific website addresses have been visited will appear.
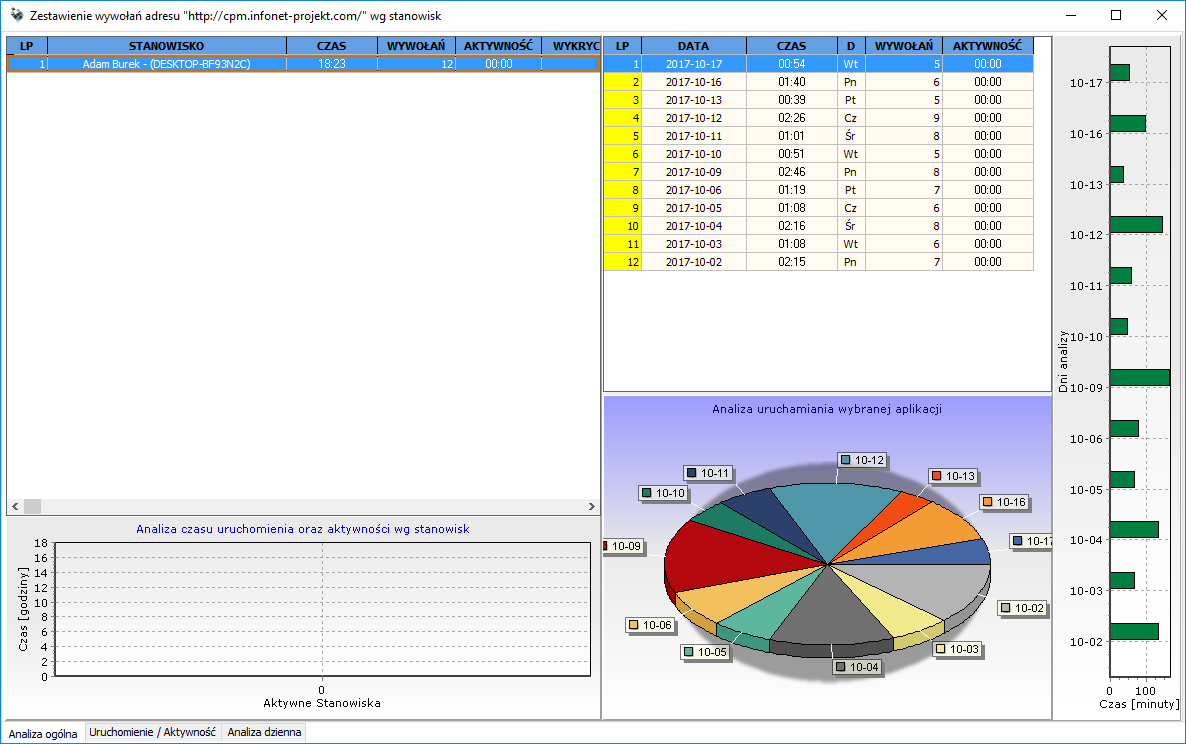
In the Report of activates address list, you can check the date and time for which the page was opened.
User activity
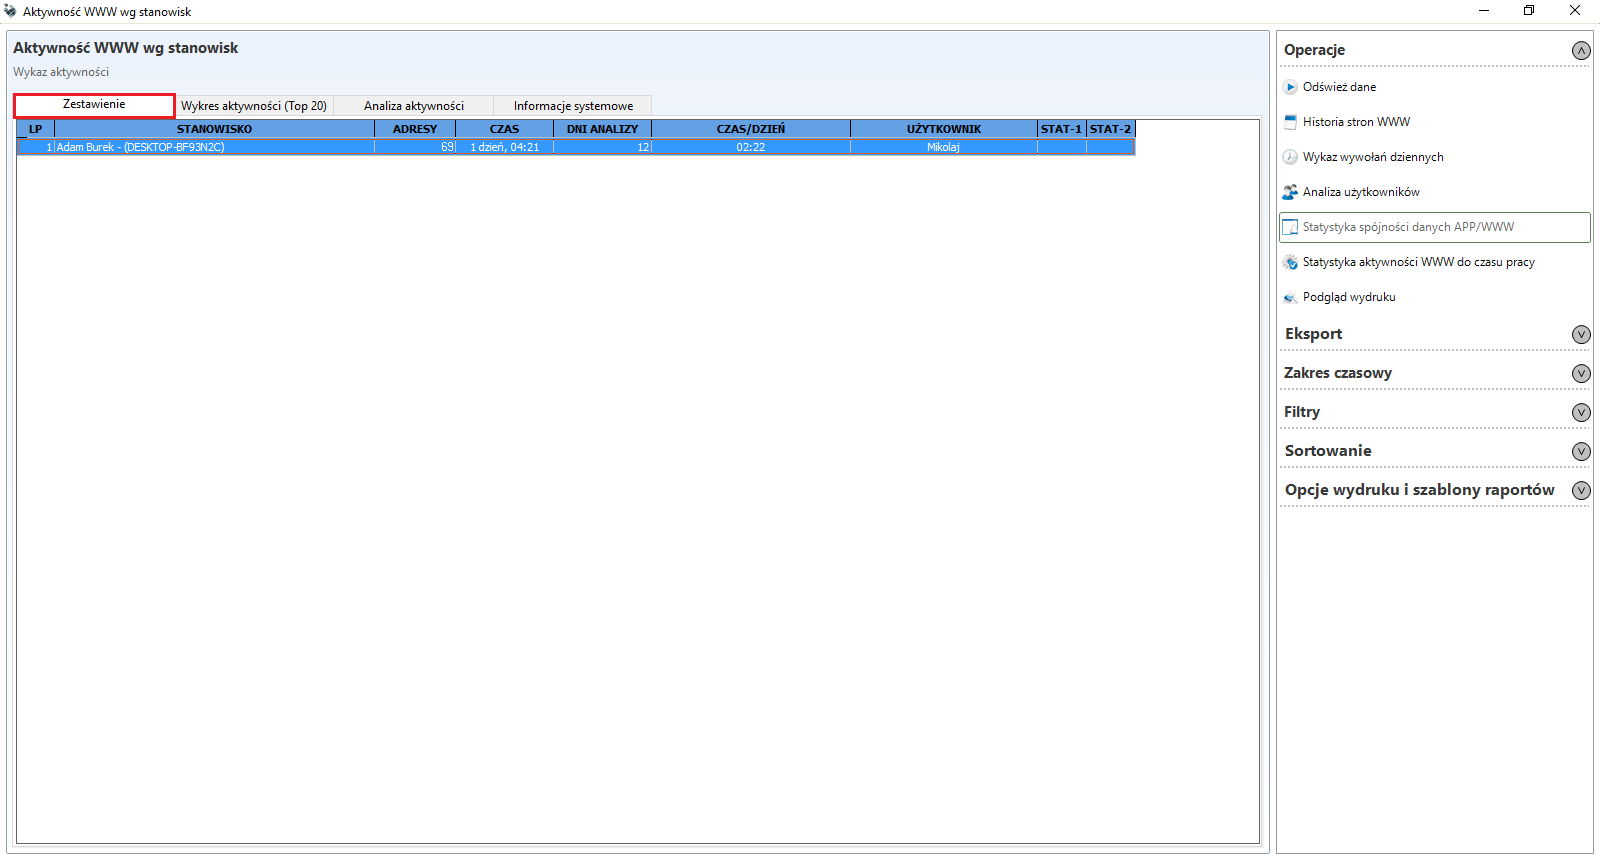
In the User Activity window in the Report tab, there is a list of positions with summary information on user activity.
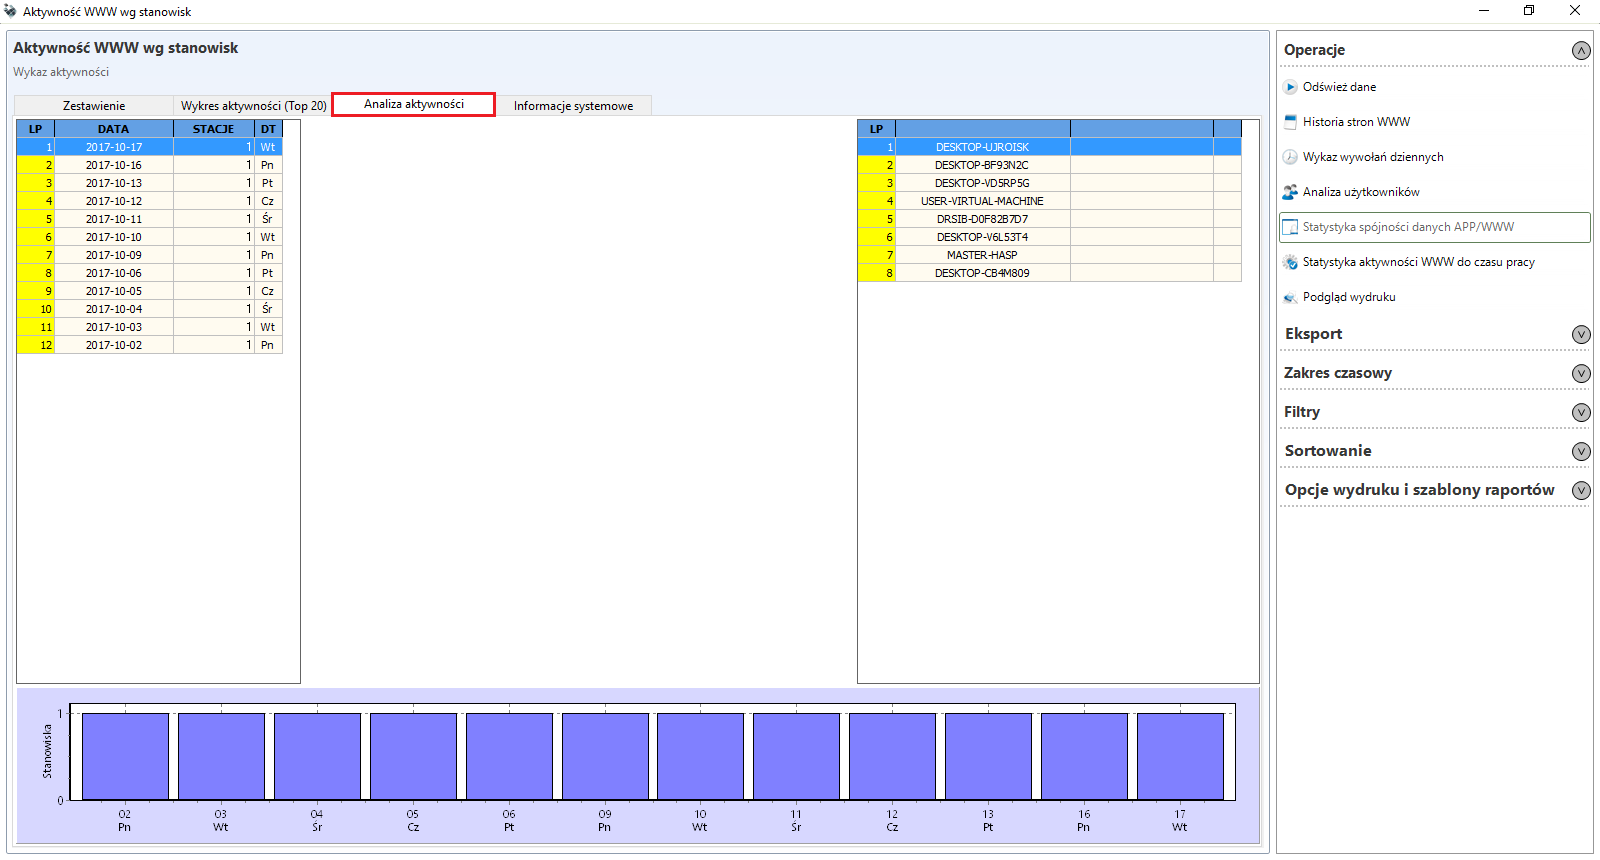
The tab Activity analysis shows the activity of the posts on specific days.
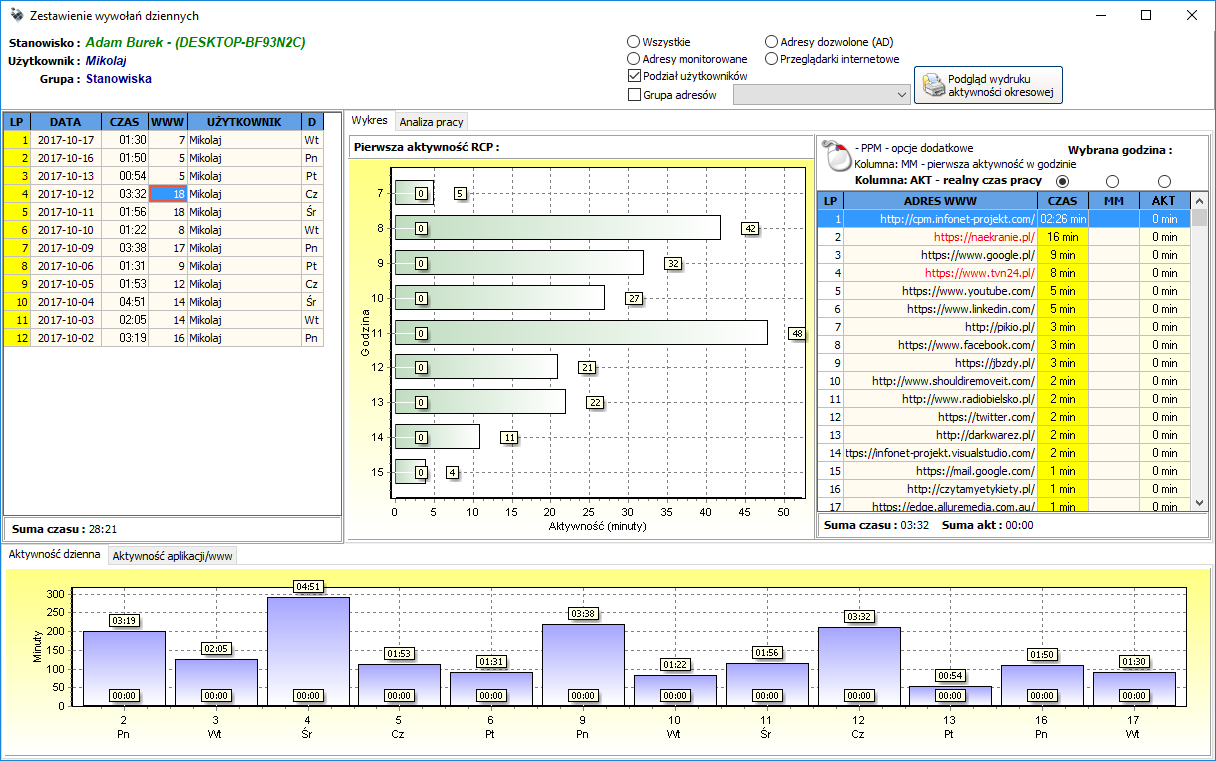
By clicking the Website history button in a new window, the details of the web addresses visited are displayed for the period of time for the selected position. The displayed window contains all addresses that were in the foreground in the current time interval. Clicking on any address will display in the right part of the window the date when the given page was visited and the time of activity (in hours and minutes). In the lower part of the window the same data are presented in the form of a bar chart divided into individual days.
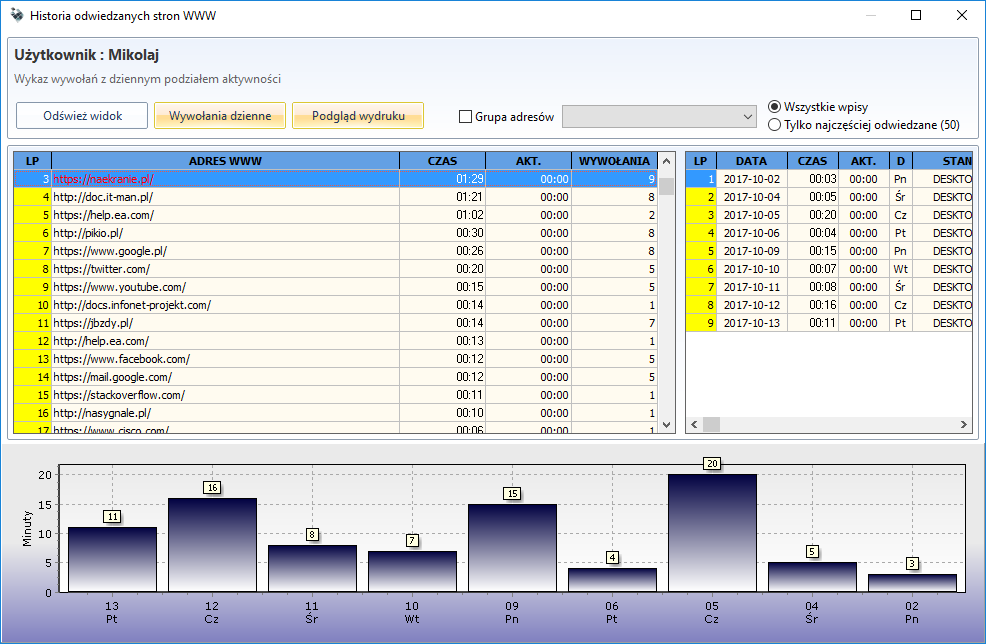
Daily activities report is shown in the bar chart, at which times the page was open (in the foreground) and for how many minutes.
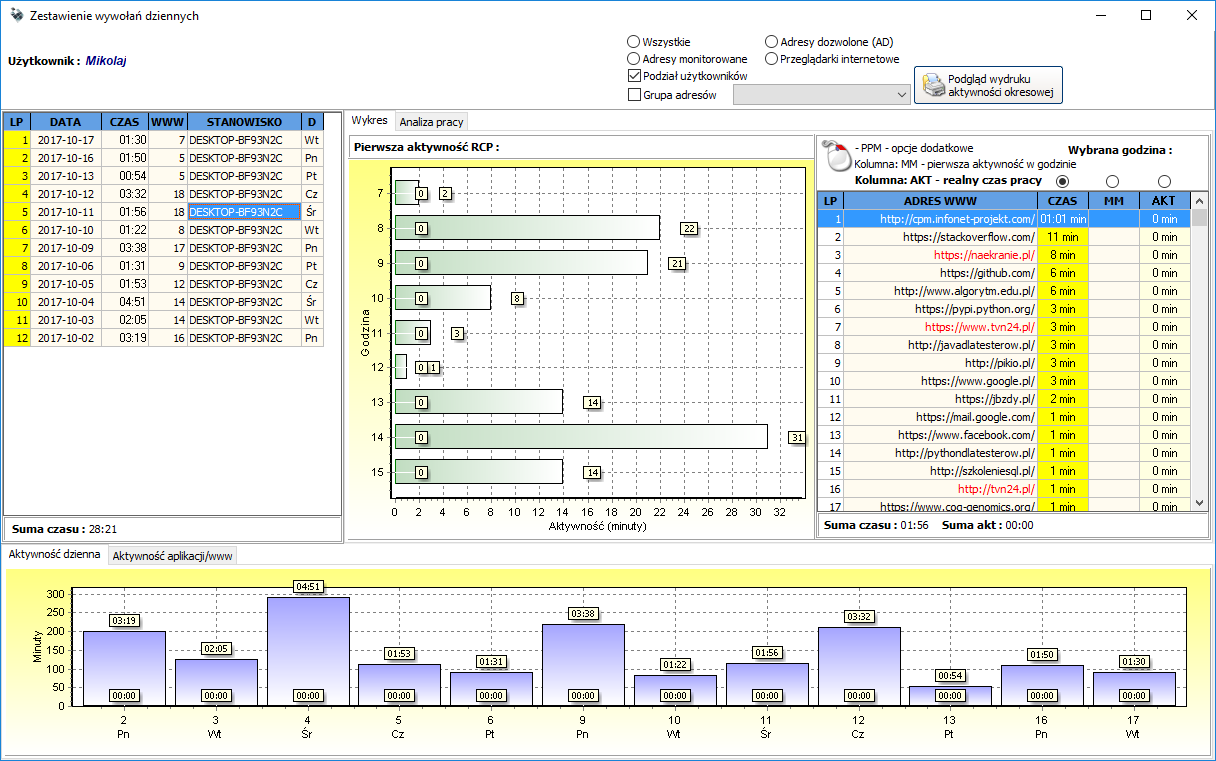
The third button in the web activity window is User analysis. This button opens a similar window as the Day activities report, except that the Daily activities report takes into account the user from the selected station, while the User Analysis displays the data of the user who logged on to any station. If a user only logged on to the selected station, the report will look the same as the daily activities report. However, if the user has logged on to multiple stations, the window on the left will contain entries from all stations.
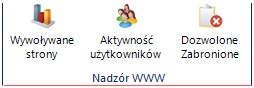
Allowed/Deny
Pressing the Allowed/Deny button on the Users monitoring tab in the WWW analysis section opens a window with a list of permitted and prohibited sites. On the basis of this list, when the blockade of pages on the workstation is activated, the page opened in the browser is verified and a message is displayed if a forbidden page is detected and/or the browser is closed.
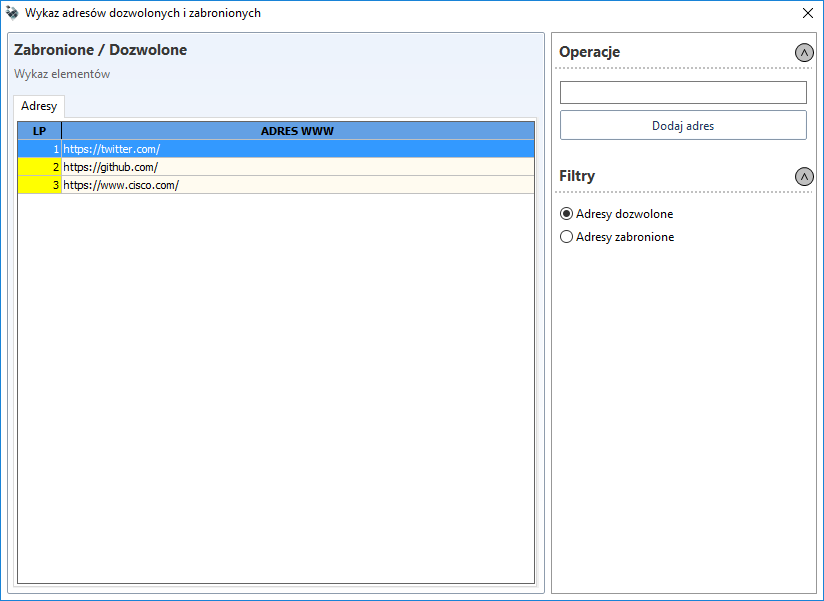
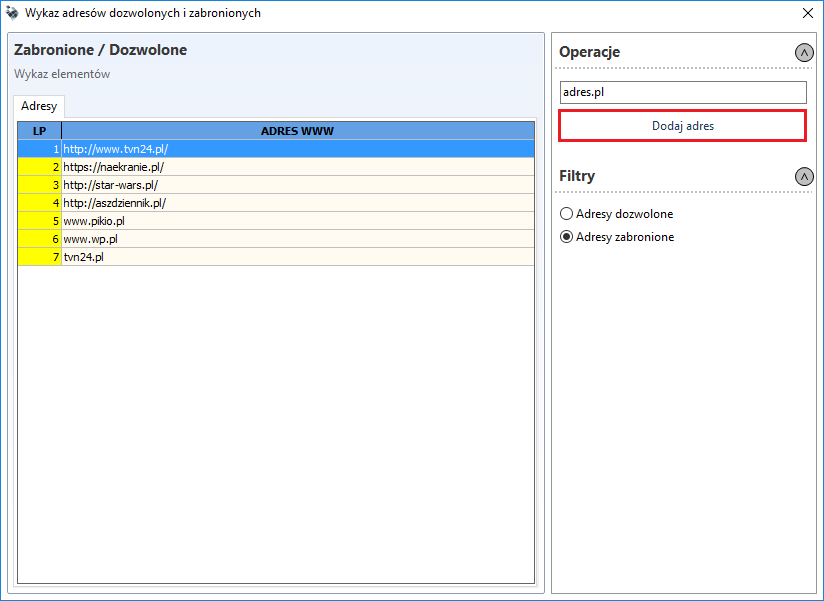
In this window, you can add an address to the list of allowed/forbidden addresses by selecting the appropriate option - Allowed addresses or Forbidden addresses, and then entering the address fragment in the field above the list and clicking the Add an address button.
You can also add a page to the list of allowed/forbidden addresses from the Day activities repor, User activity, Website history** as well as WWW activity. To do so, from the pop-up menu, select Add address/application to allowed address/application list or the Add address/application to forbidden address/application list.